Research
Biogas plants are a major part of the energy transition. Within the renewable energies biomass contributes 24 percent to the generation of electricity. Methane gas results by fermenting liquid manure, bio waste and plants like corn. It is burned in block-type thermal power stations and transitioned to electricity. Filling the biogas plant daily with biomass and keeping a constant temperature are important factors to the generation of methane gas.
Problem
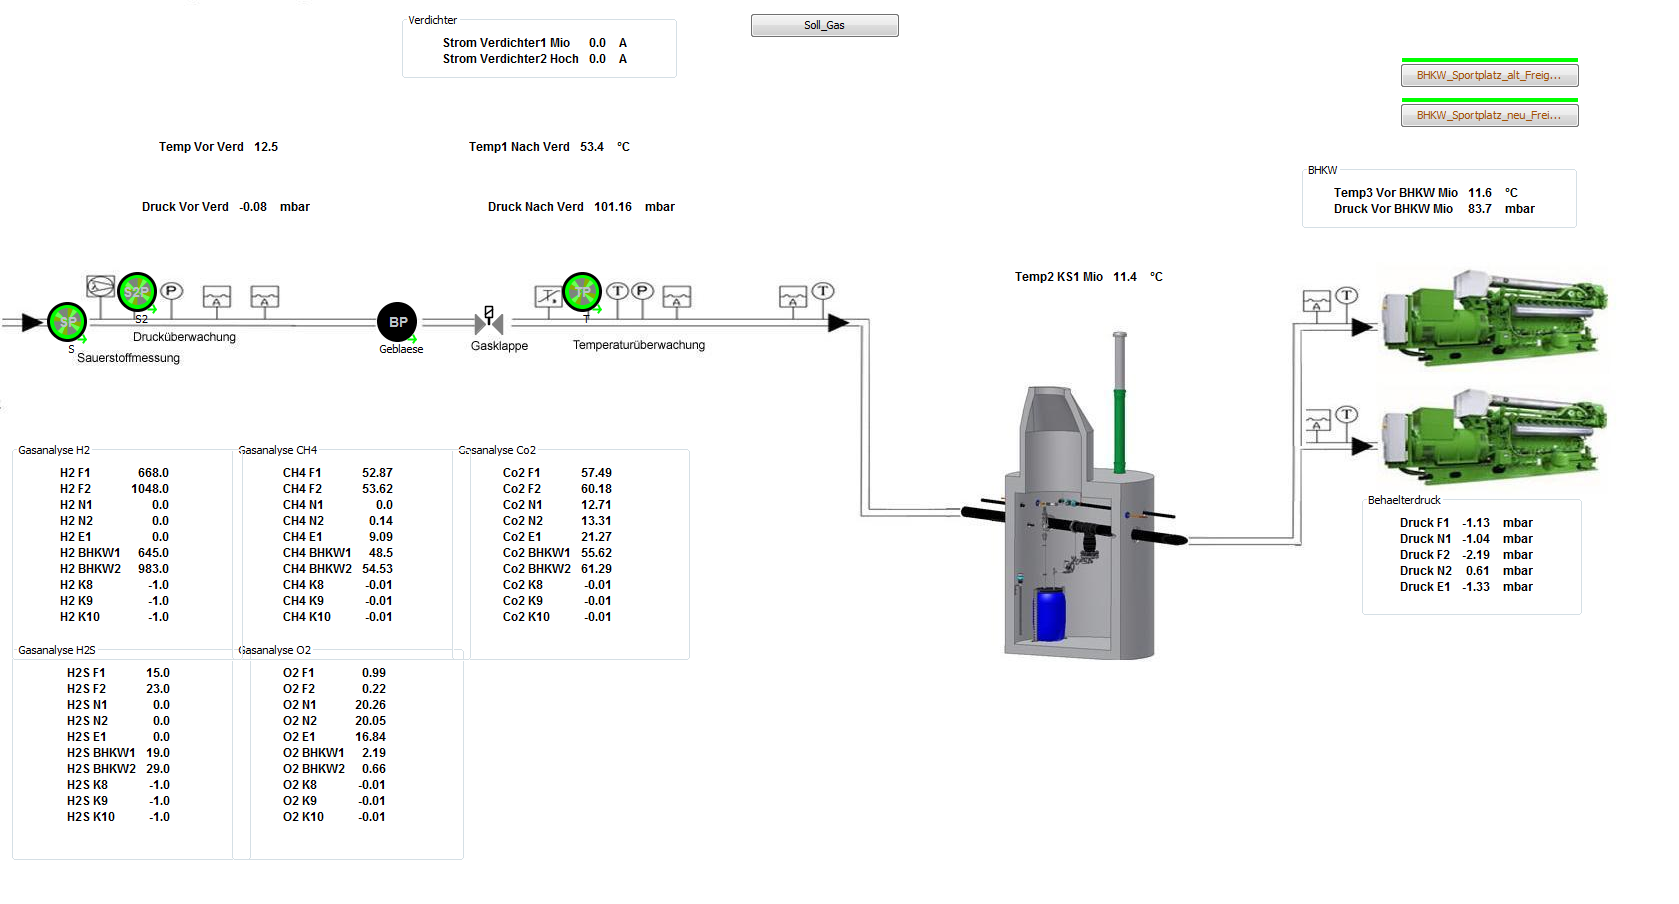
In many cases the user interface of controlling and monitoring softwares of biogas plants are outdated and don’t show enough information. The controlling software of the plant we were working with had been missing functions to monitor the gas values. It is difficult to get a fast overview of recent values because they can only be shown via text. There is another important information that is missing for a plant owner to run the plant efficiently.
Prototyping
To understand how a biogas plant works in detail and to learn about the factors that influence the production of methane gas, we decided to build our own miniature plant. The main component of the plant is a digester which is regularly filled with biomass.
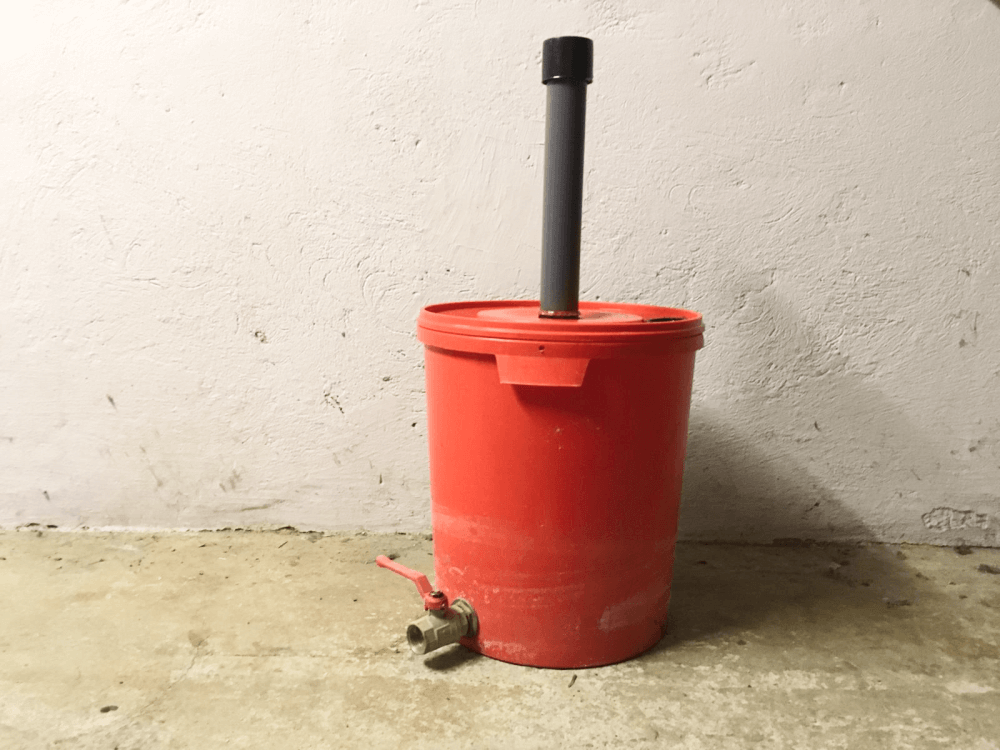
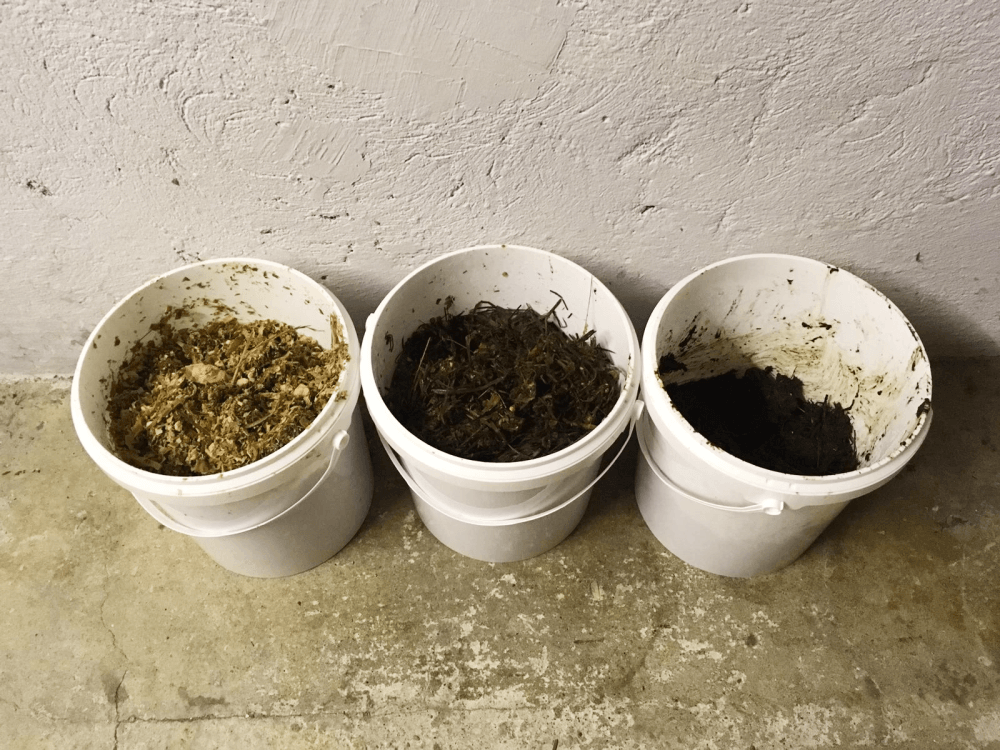
With the help of different prototyping componenents we collected gas and temperature values.
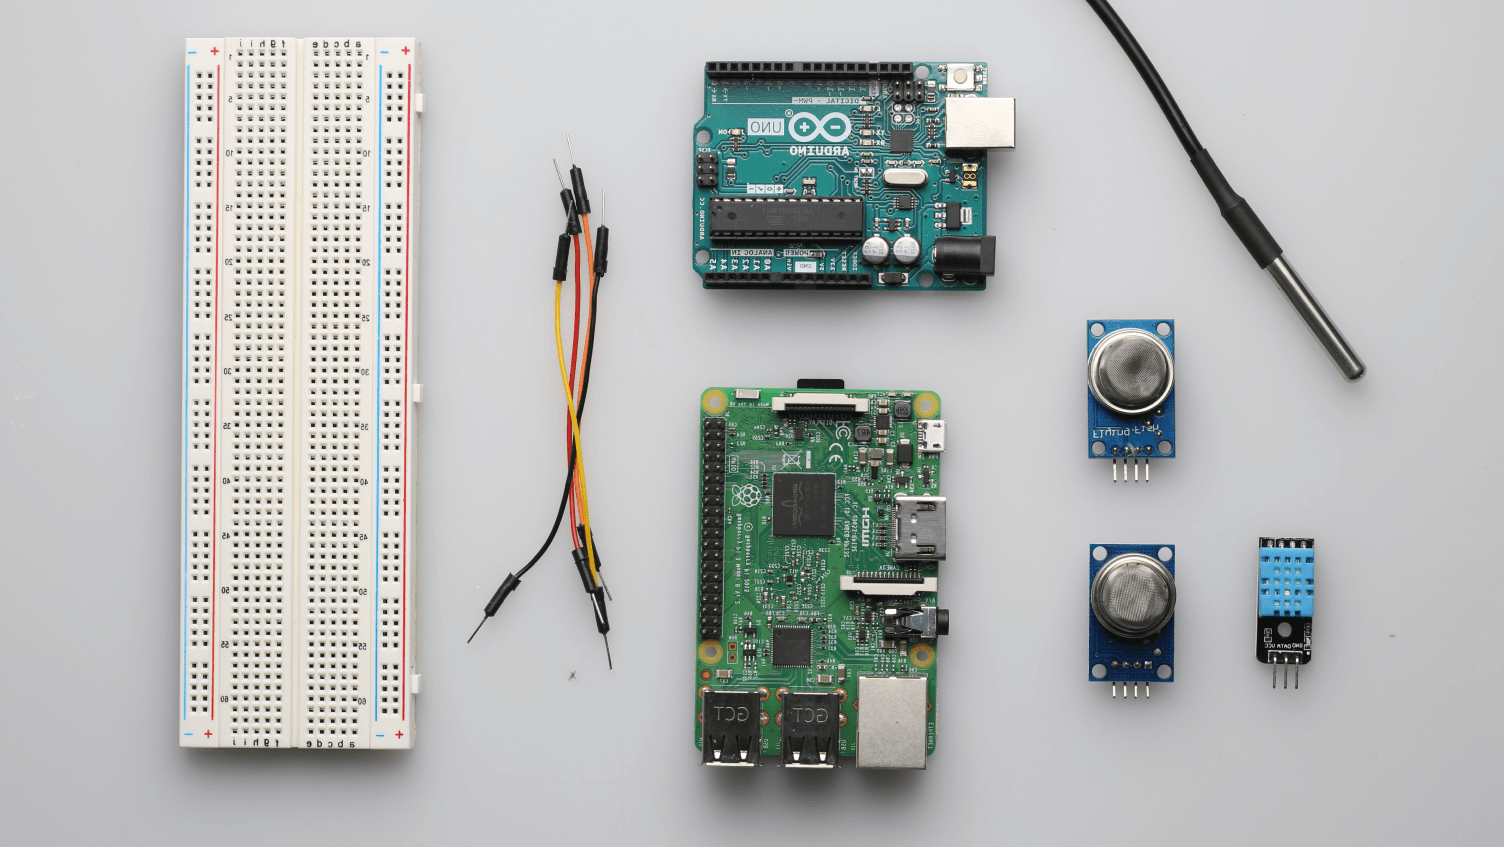
The generated data is used to test the redesigned interface with recent and live values. The main components are the microcontrollers and the cloud database that built the backends infrastructure. For the sensors were running in a local network these componenents were used to make the data accessible in the monitoring interface.

Result
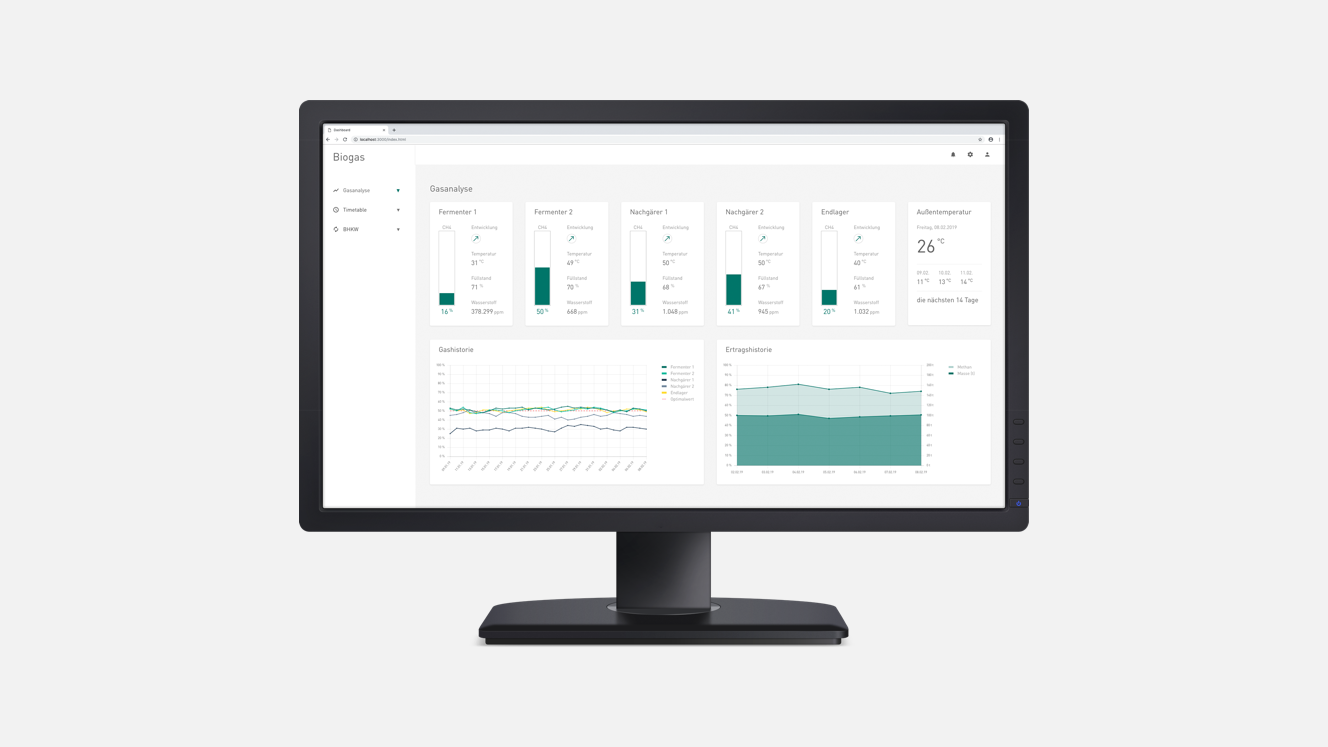
One of our main goals was to give the plant owner a quick and simple access to important information.
In order to that the we created a new information architecture and structured it in two hierarchies.
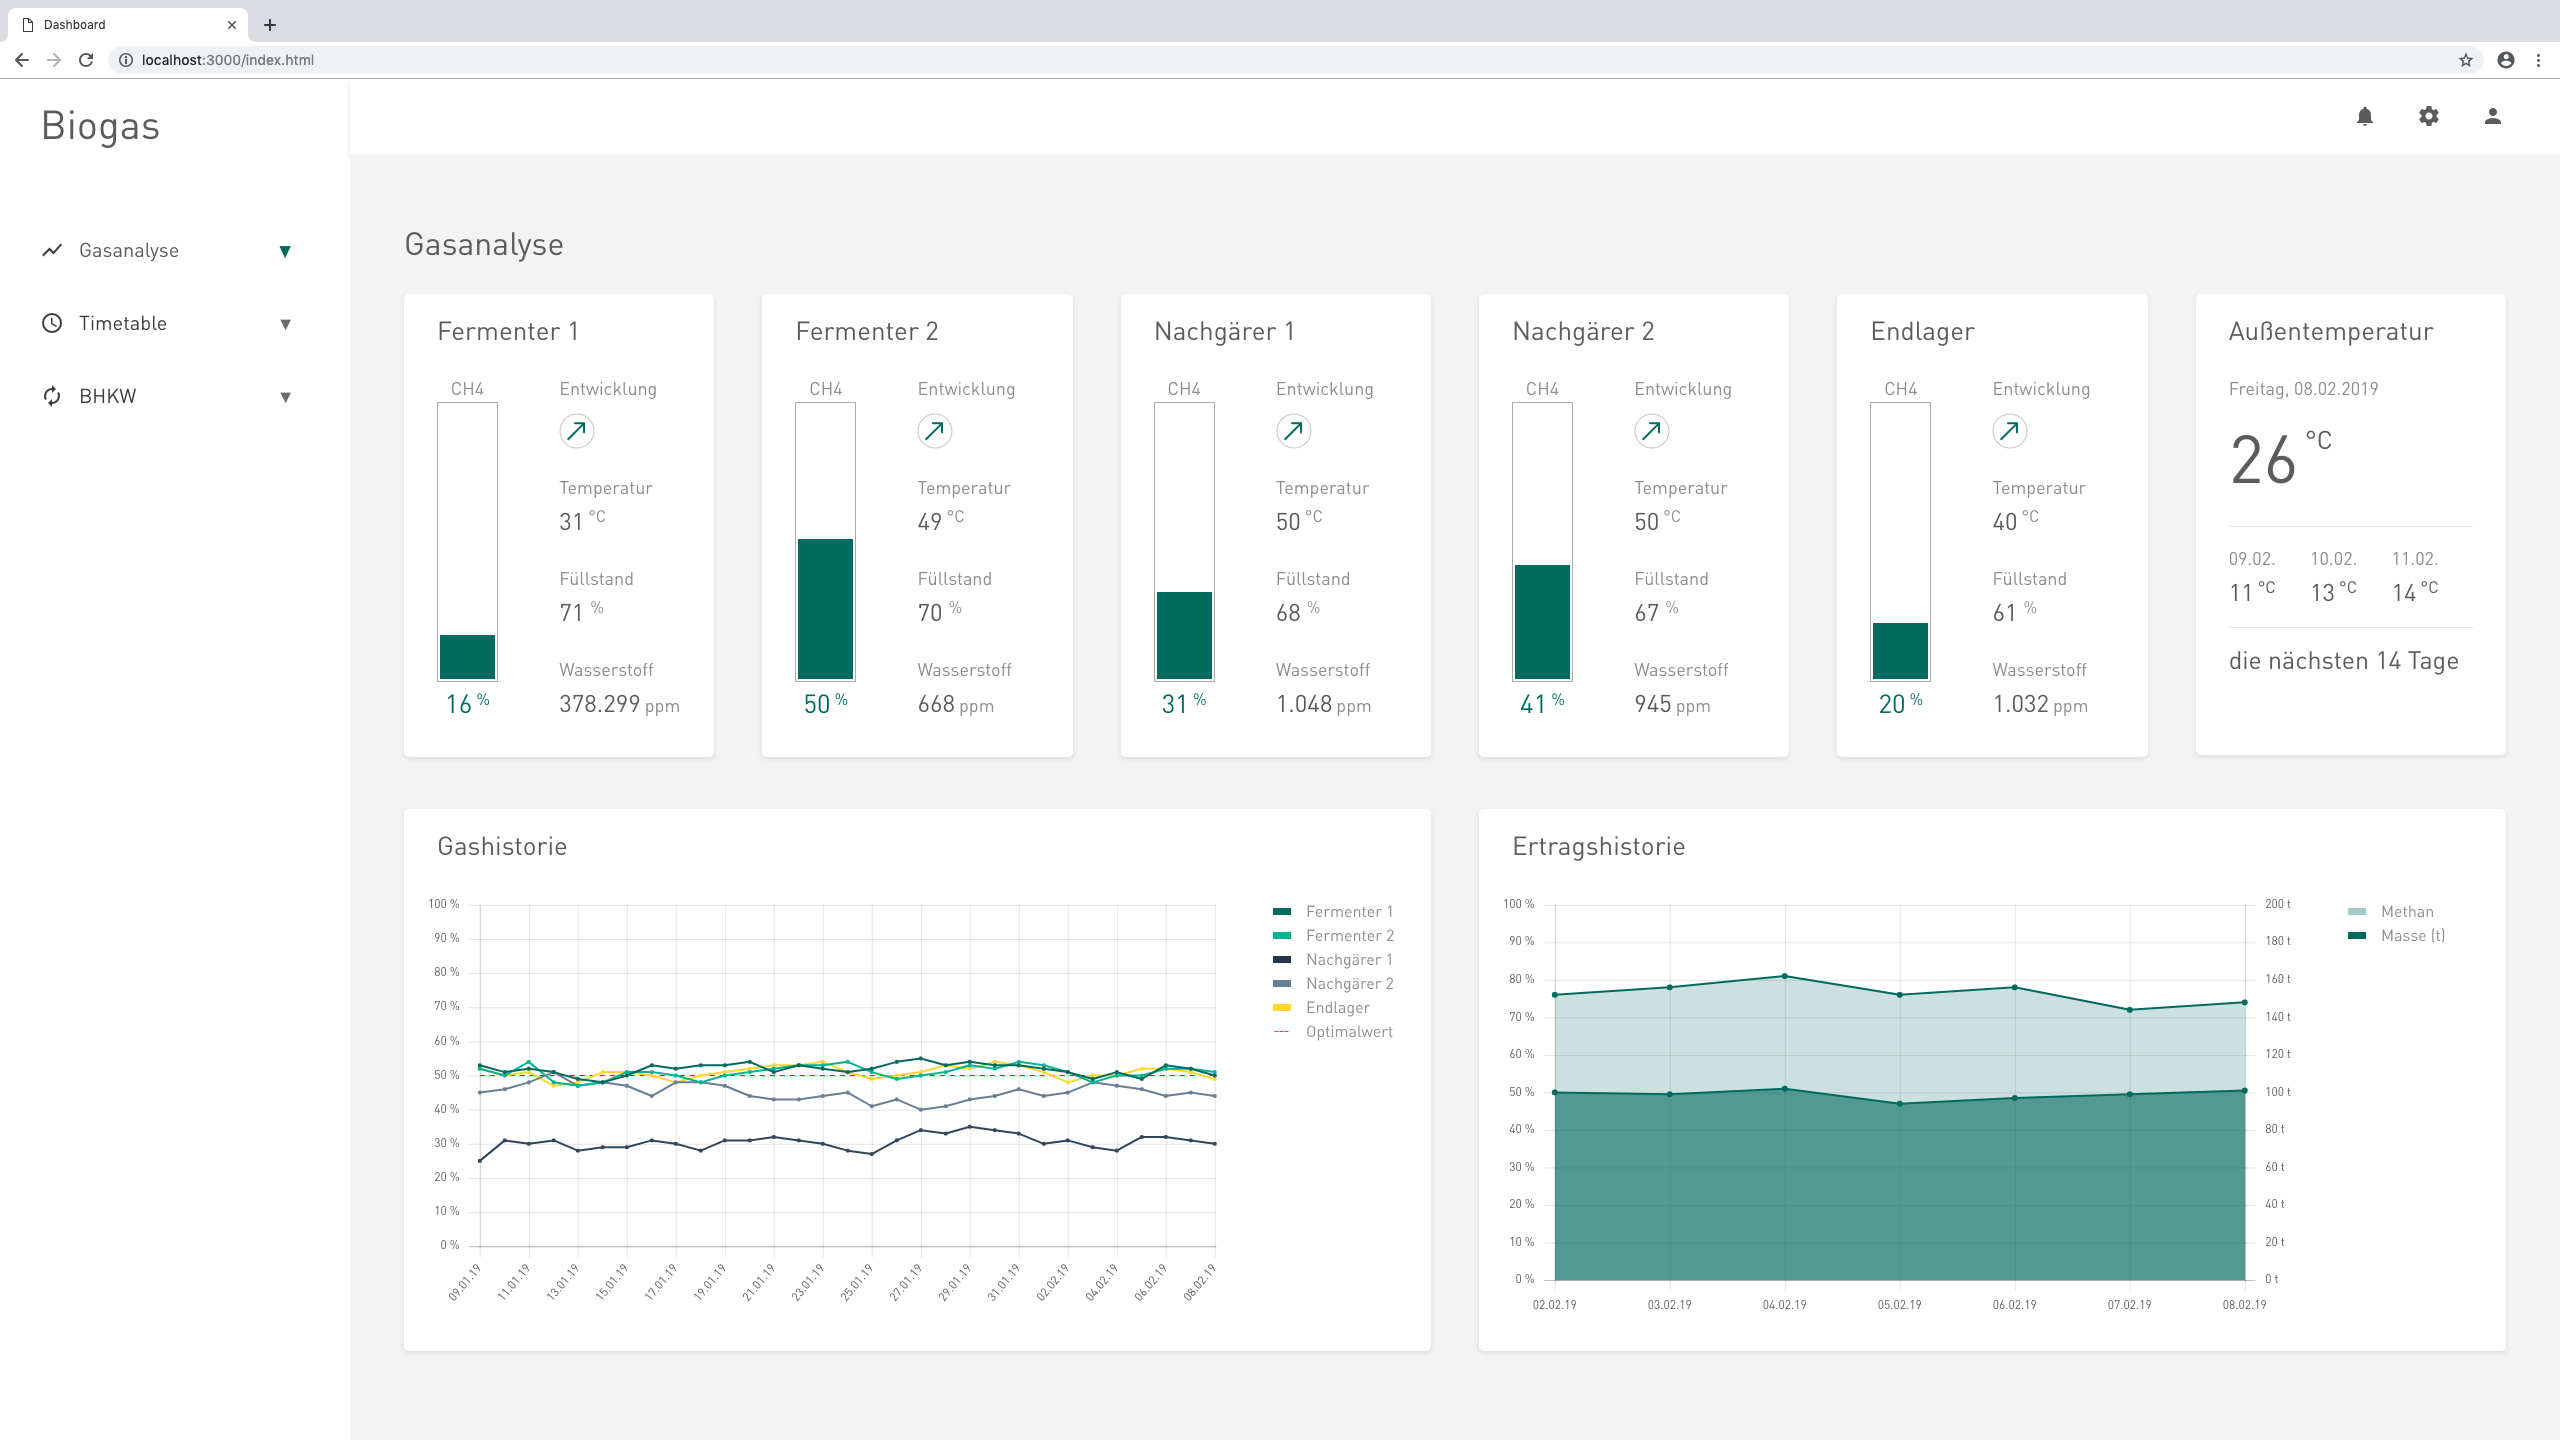
The landing page shows an overview of the most important information about the current values of the biogas plant.
Beside the current data the diagrams give a preview of the development of different gas values.
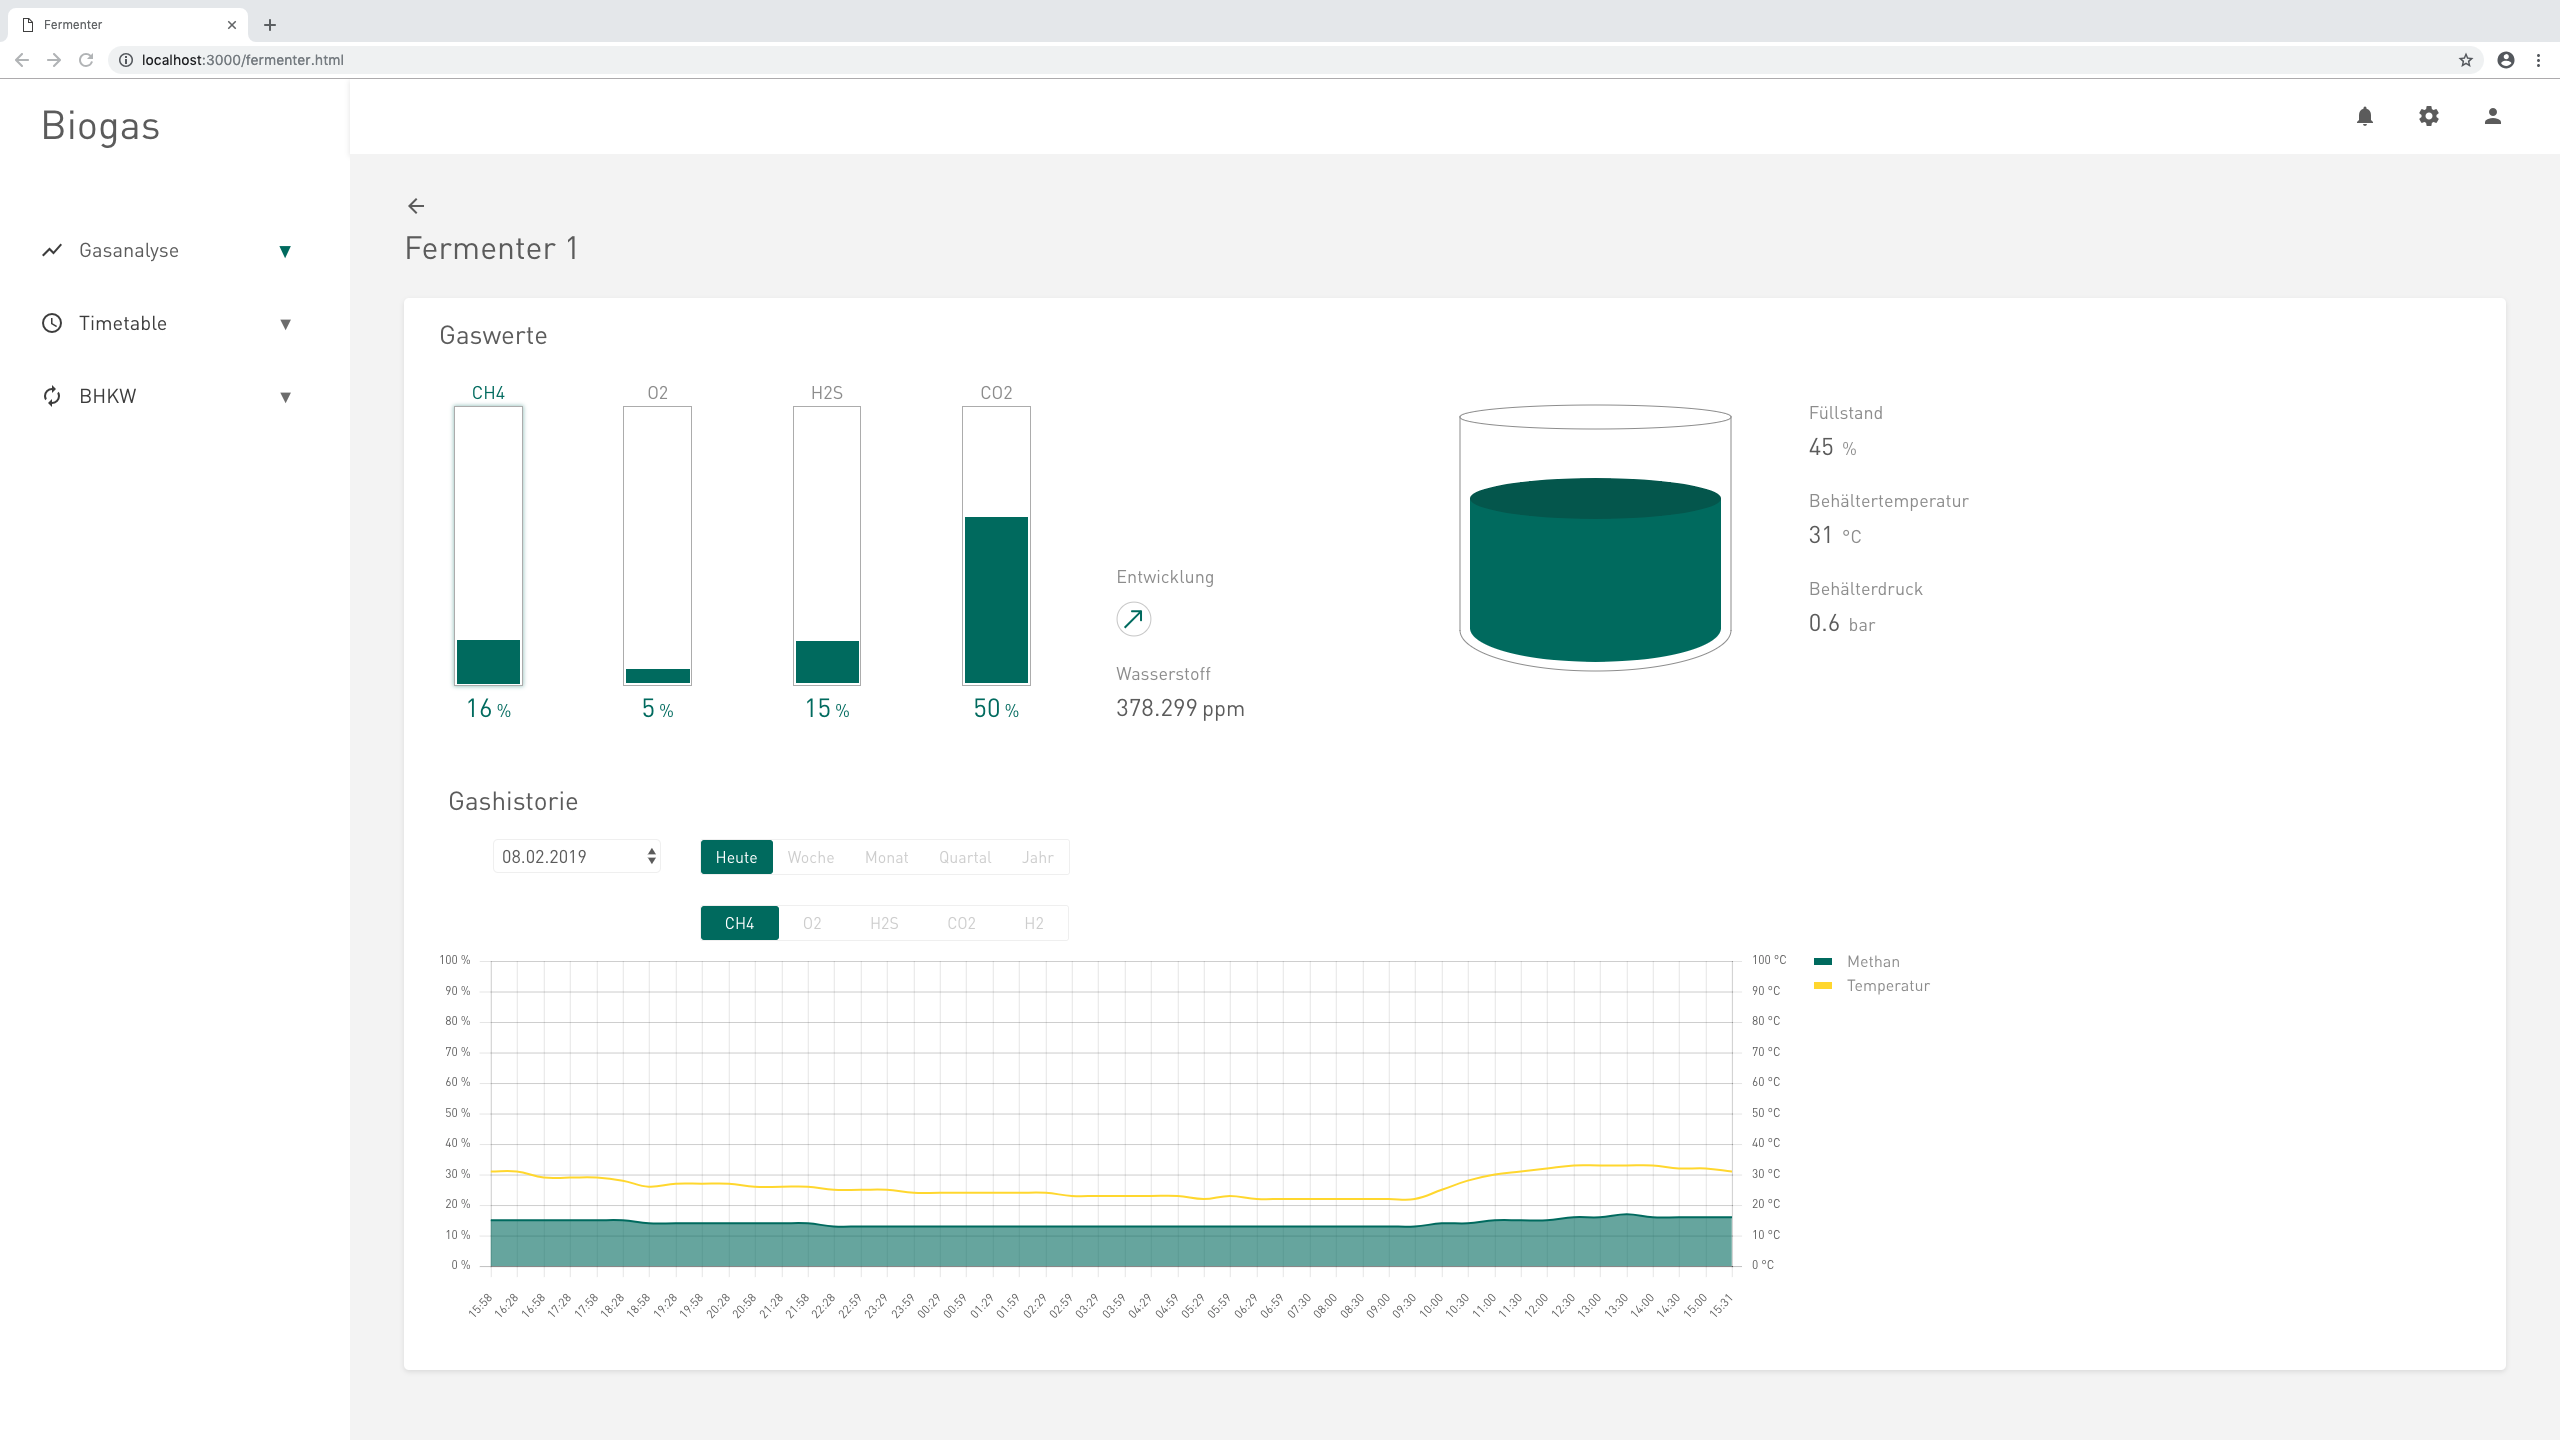
There is a page for each fermenter wich shows more and detailed information about all values that are monitored. In addition to that the development of the different gas values in this fermenter are shown in a line chart.
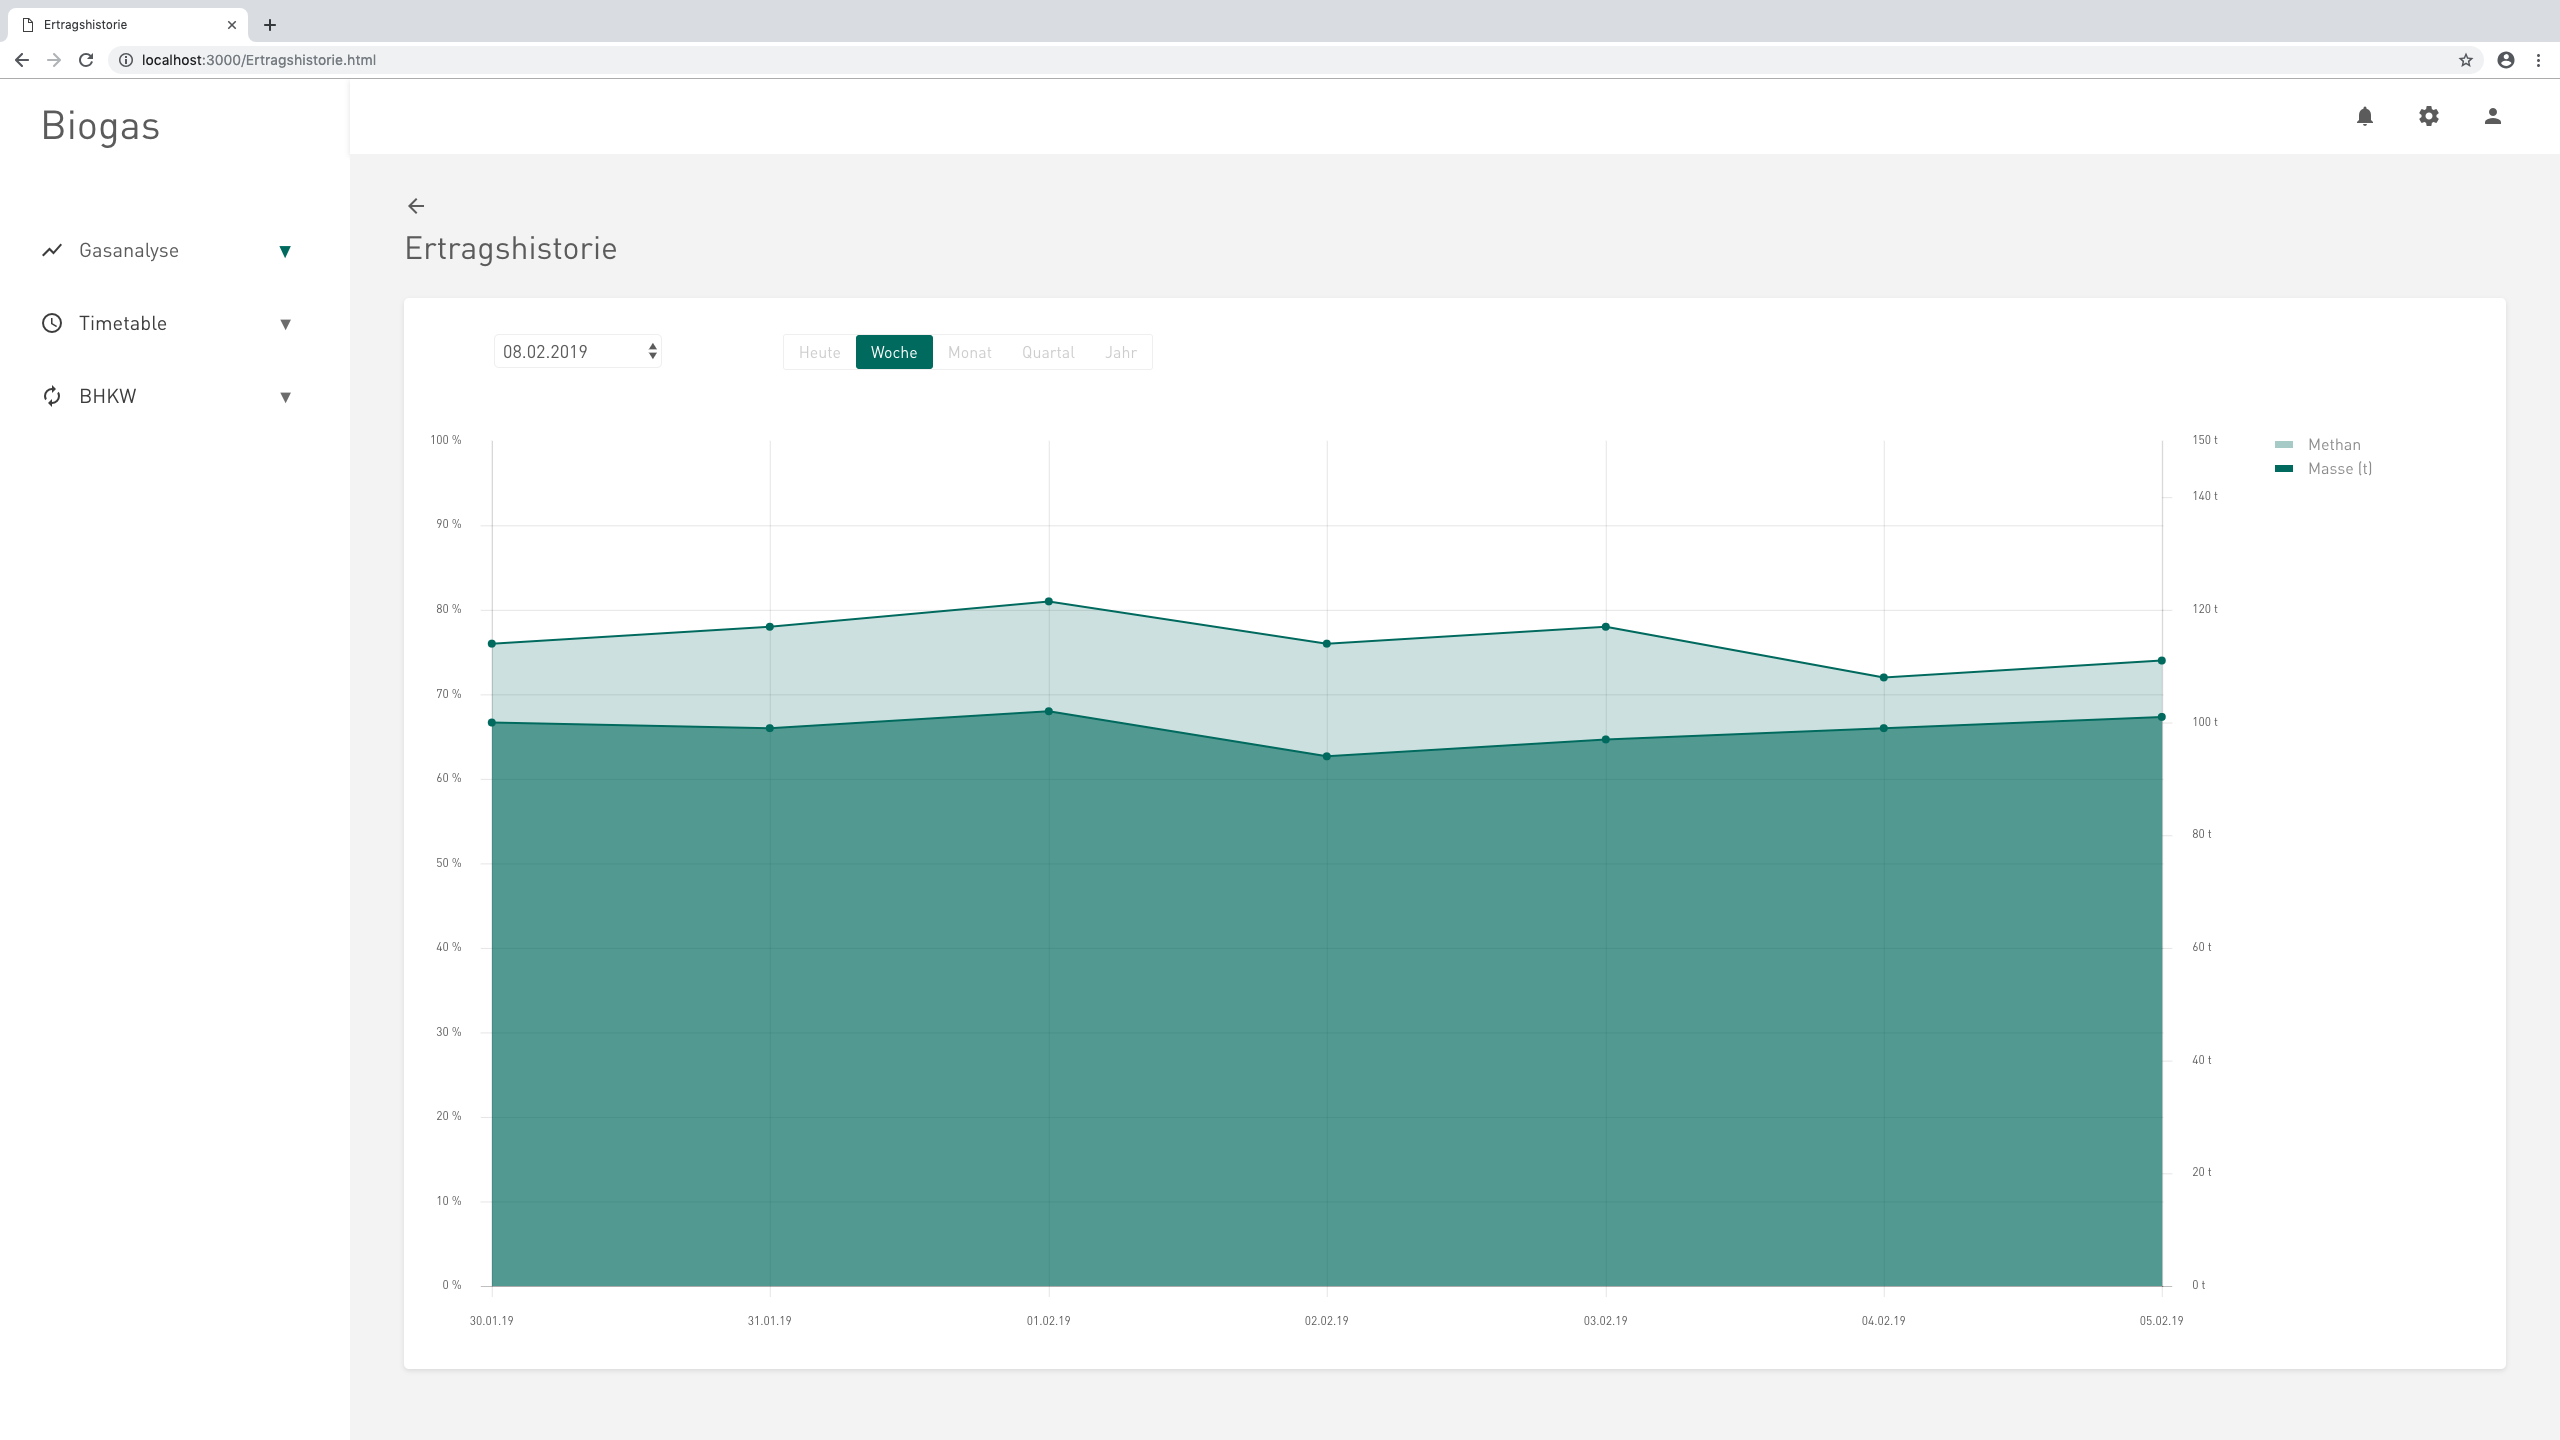
One of the pain points was the missing information of methane values in correlation with the amount of biomas that was filled in. To solve this problem we added a page which shows the development of these values in the past. This gives the plant owner the opportunity to adjust the biomass to achieve optimal concentration of methane.
Project Facts
Team: Marius Jakob, Samantha Scherf, Ethan Günther
Course: Prototyping and Redesign
Consulting: Prof. Michael Schuster, Benjamin Thomsen
University: HfG Schwaebisch Gmuend, Winter 18/19